Register today and receive access to a powerful family of studies and trading algorithms that can be applied directly to your own charts, timeframes, and preferred markets. Get Real-Time Trading Signals for CME Futures.
Everything you need to get started with professional-grade futures trading signals — at no cost, no obligation.
Real-time intraday trading signals delivered directly through Sierra Chart or TradingView
Objective entry, exit, and trend-bias signals based on rules-driven market analysis
Professional tools designed to help bring greater structure, consistency, and discipline to your trading
A comprehensive 23-page PDF eBook explaining the methodology, logic, and practical trading applications
Access to the Diamond ALGO and indicator suite, designed for use across multiple markets and timeframes
A complimentary one-on-one remote onboarding session and online support meeting for installation and setup
Learn how each indicator works, its primary purpose, and how it can be incorporated into your trading strategy.
New to the indicator suite? These introductory videos guide you through enabling your indicators inside TradingView and provide an overview of the complete Diamond ALGO family, helping you understand how each component works together.
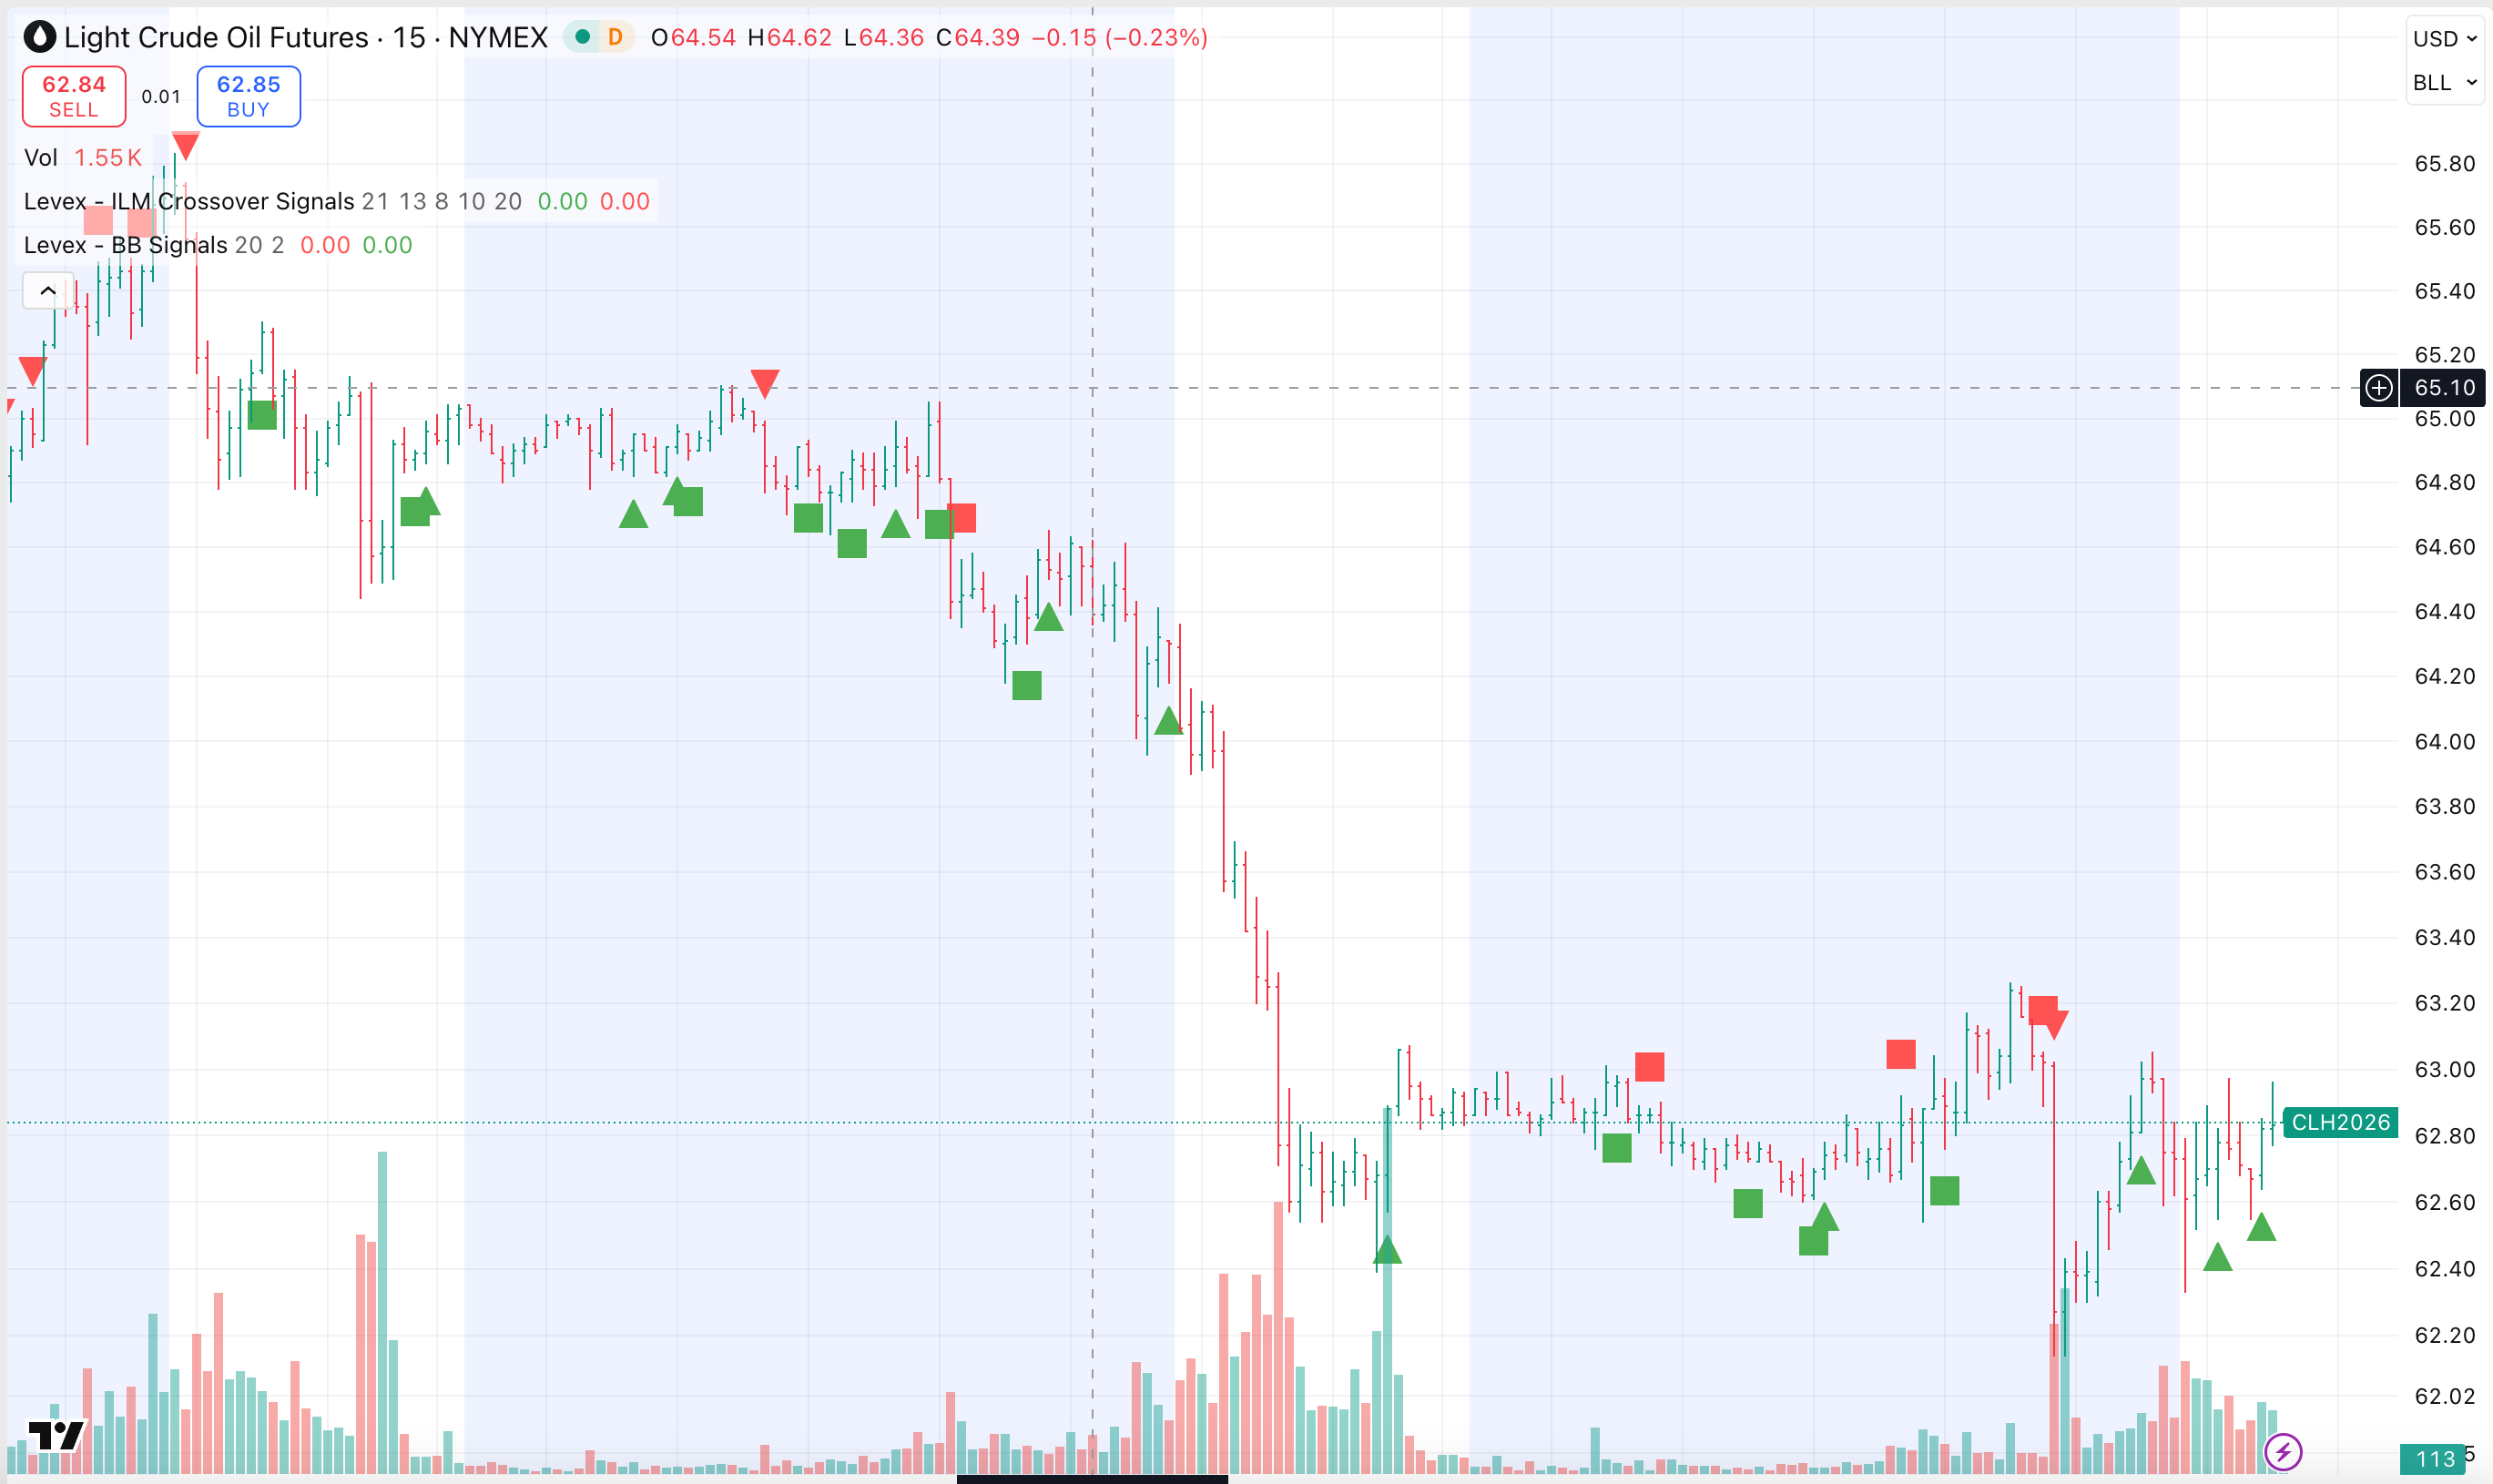
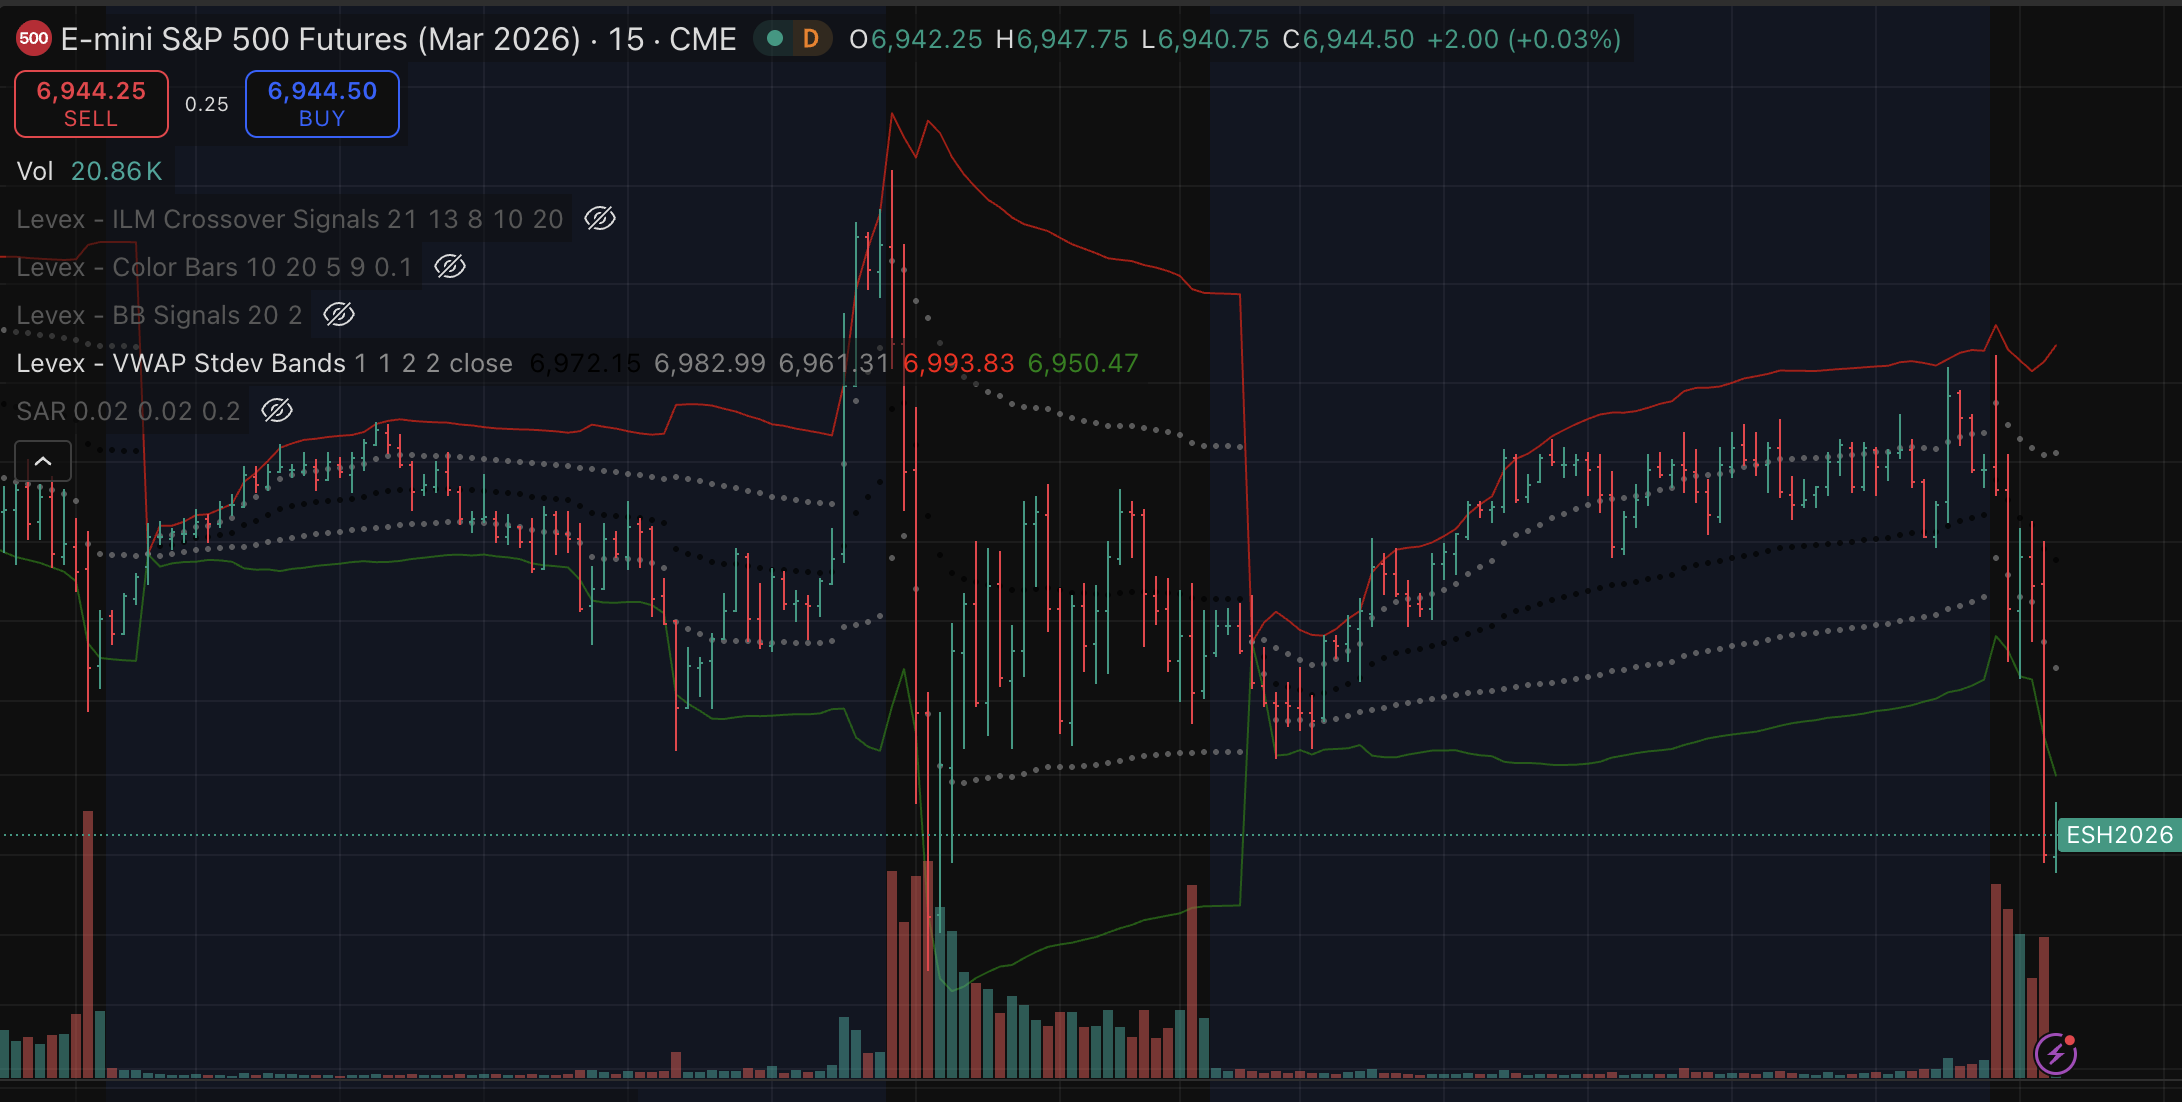
The E-Futures VWAP Market Structure Bands combine Volume Weighted Average Price (VWAP) analysis with statistically derived volatility zones to help traders identify areas where price may encounter support, resistance, expansion, or reversion.
At the core of the study is the VWAP benchmark, widely used by professional traders and institutions to gauge fair market value throughout the trading session. Surrounding the VWAP are dynamic volatility bands that adapt to changing market conditions, helping traders visualize when markets may be stretched, balanced, or gaining directional conviction.
Whether you're trading equity index futures, commodities, currencies, or fixed income products, the study can provide valuable insight into market positioning and price behavior.
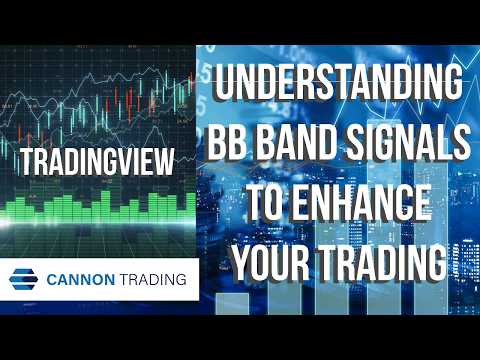
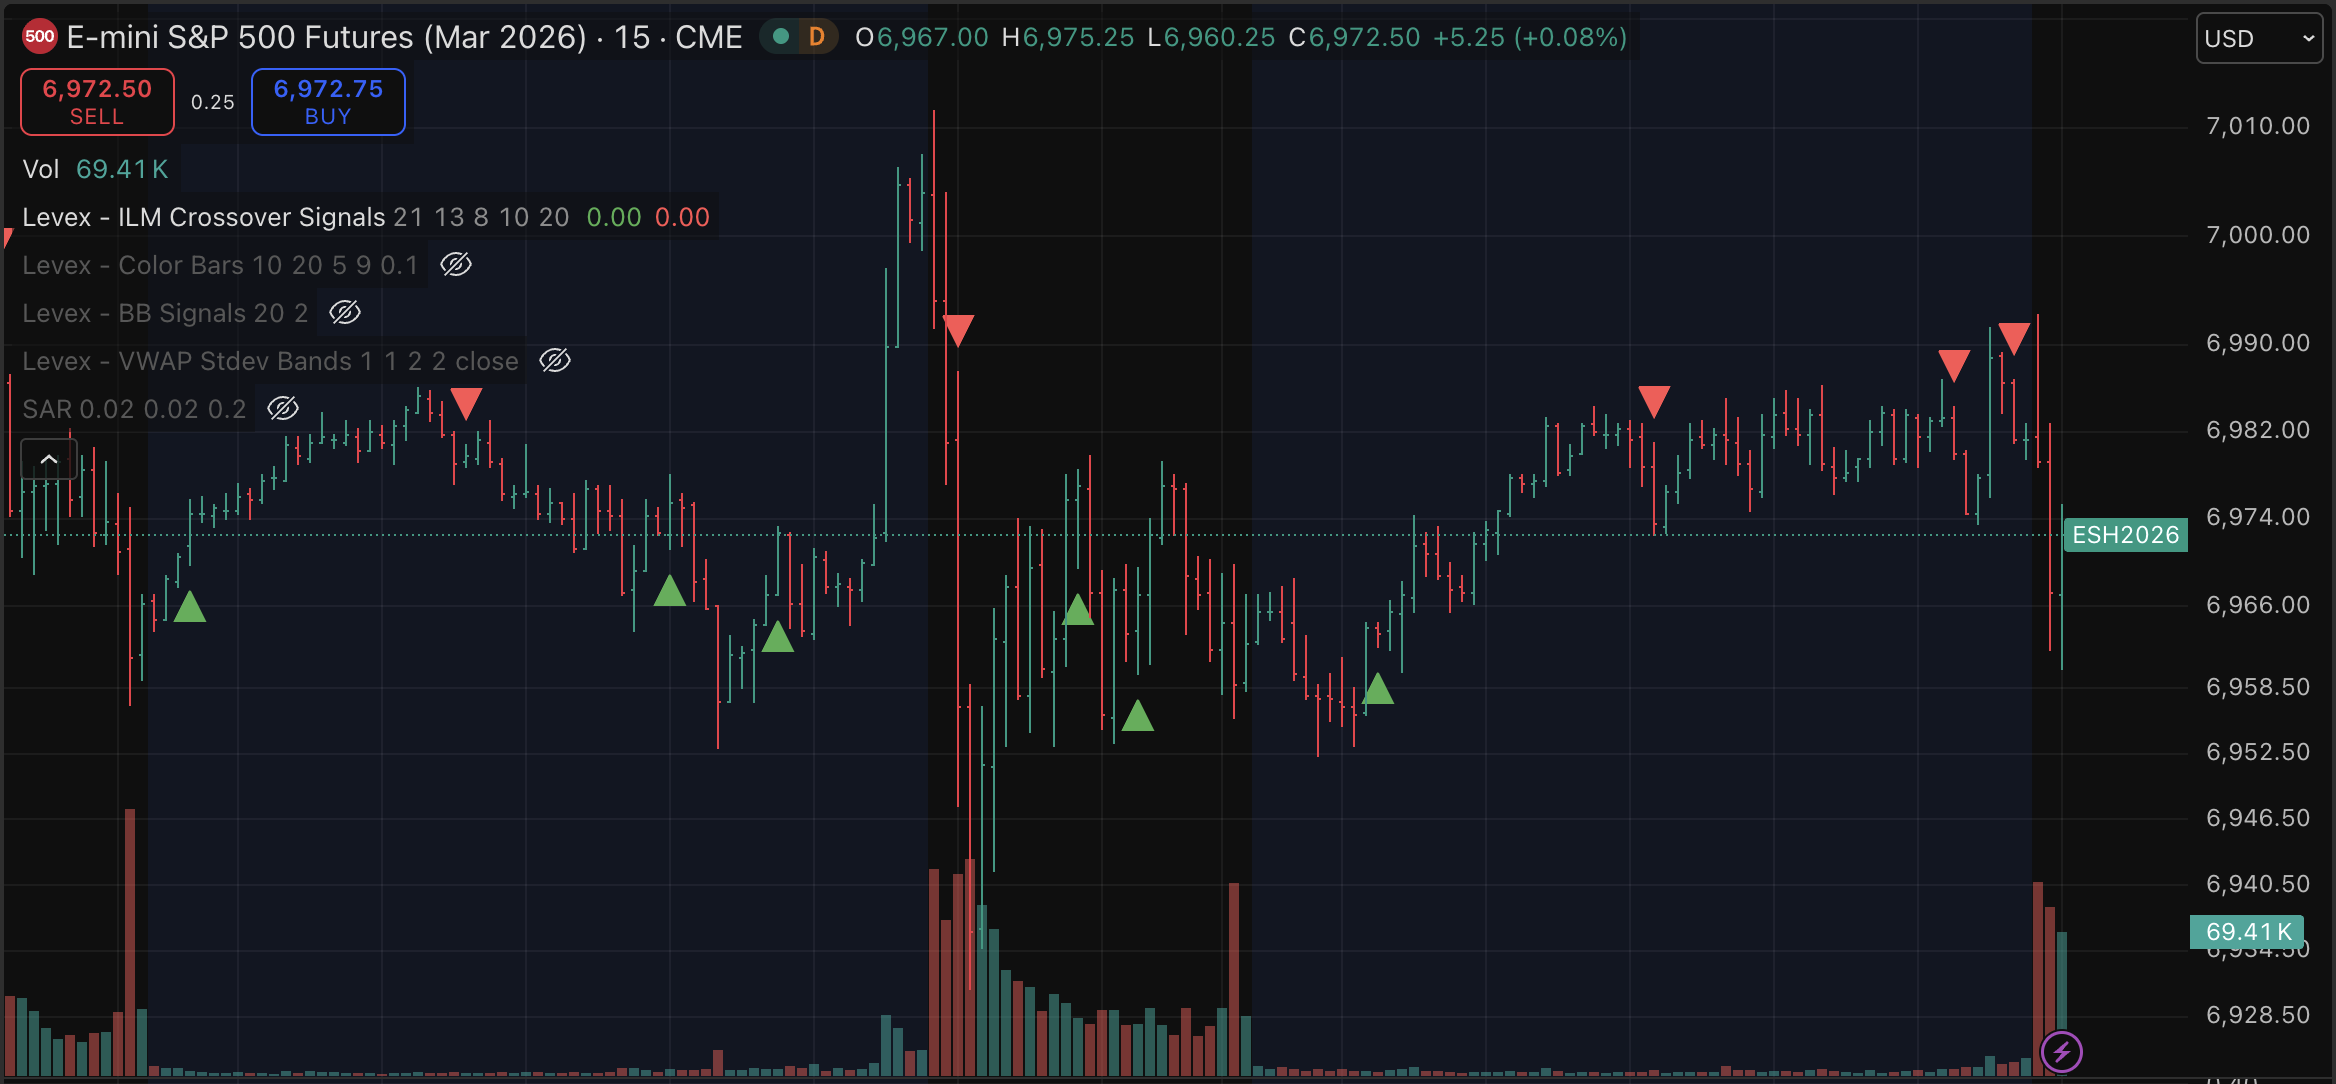
The E-Futures Trend Transition Signals study is designed to help traders identify potential shifts in market direction by analyzing the relationship between price movement, volume participation, and adaptive moving-average behavior.
Rather than waiting for trends to become obvious, the study highlights developing market transitions that may indicate emerging bullish or bearish momentum. Visual markers are displayed directly on the chart, helping traders quickly recognize areas where market sentiment may be changing.
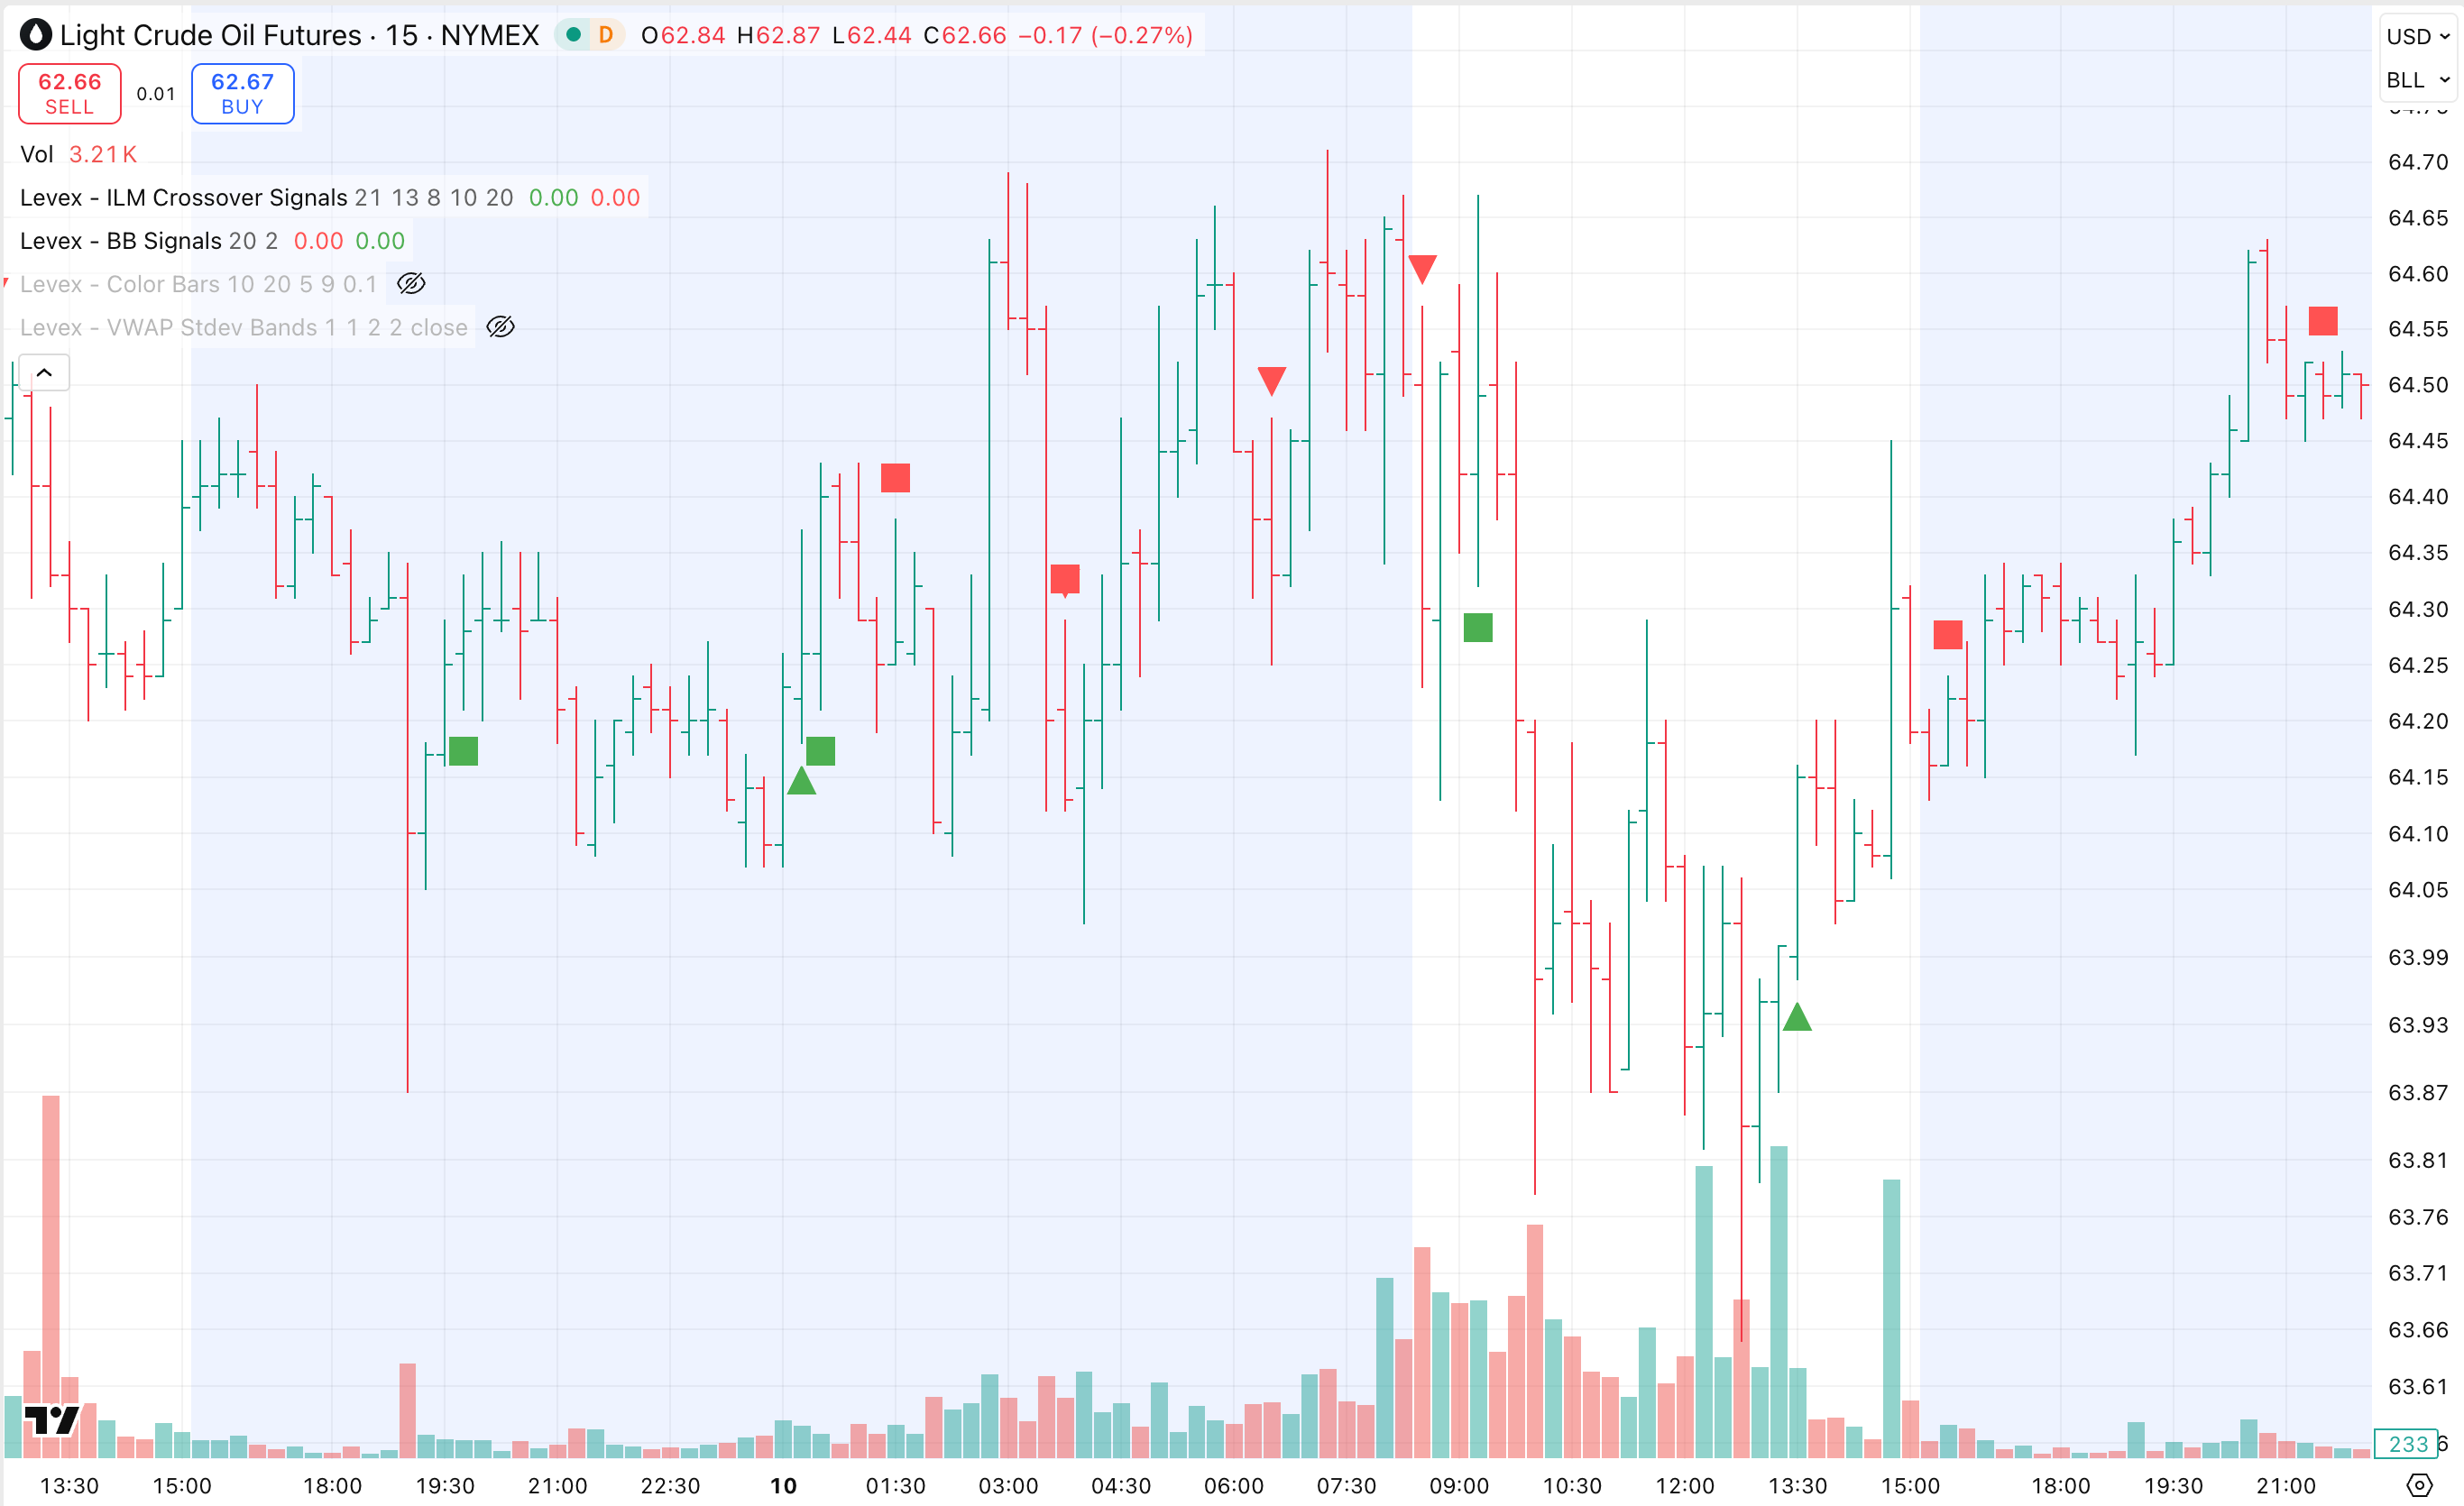
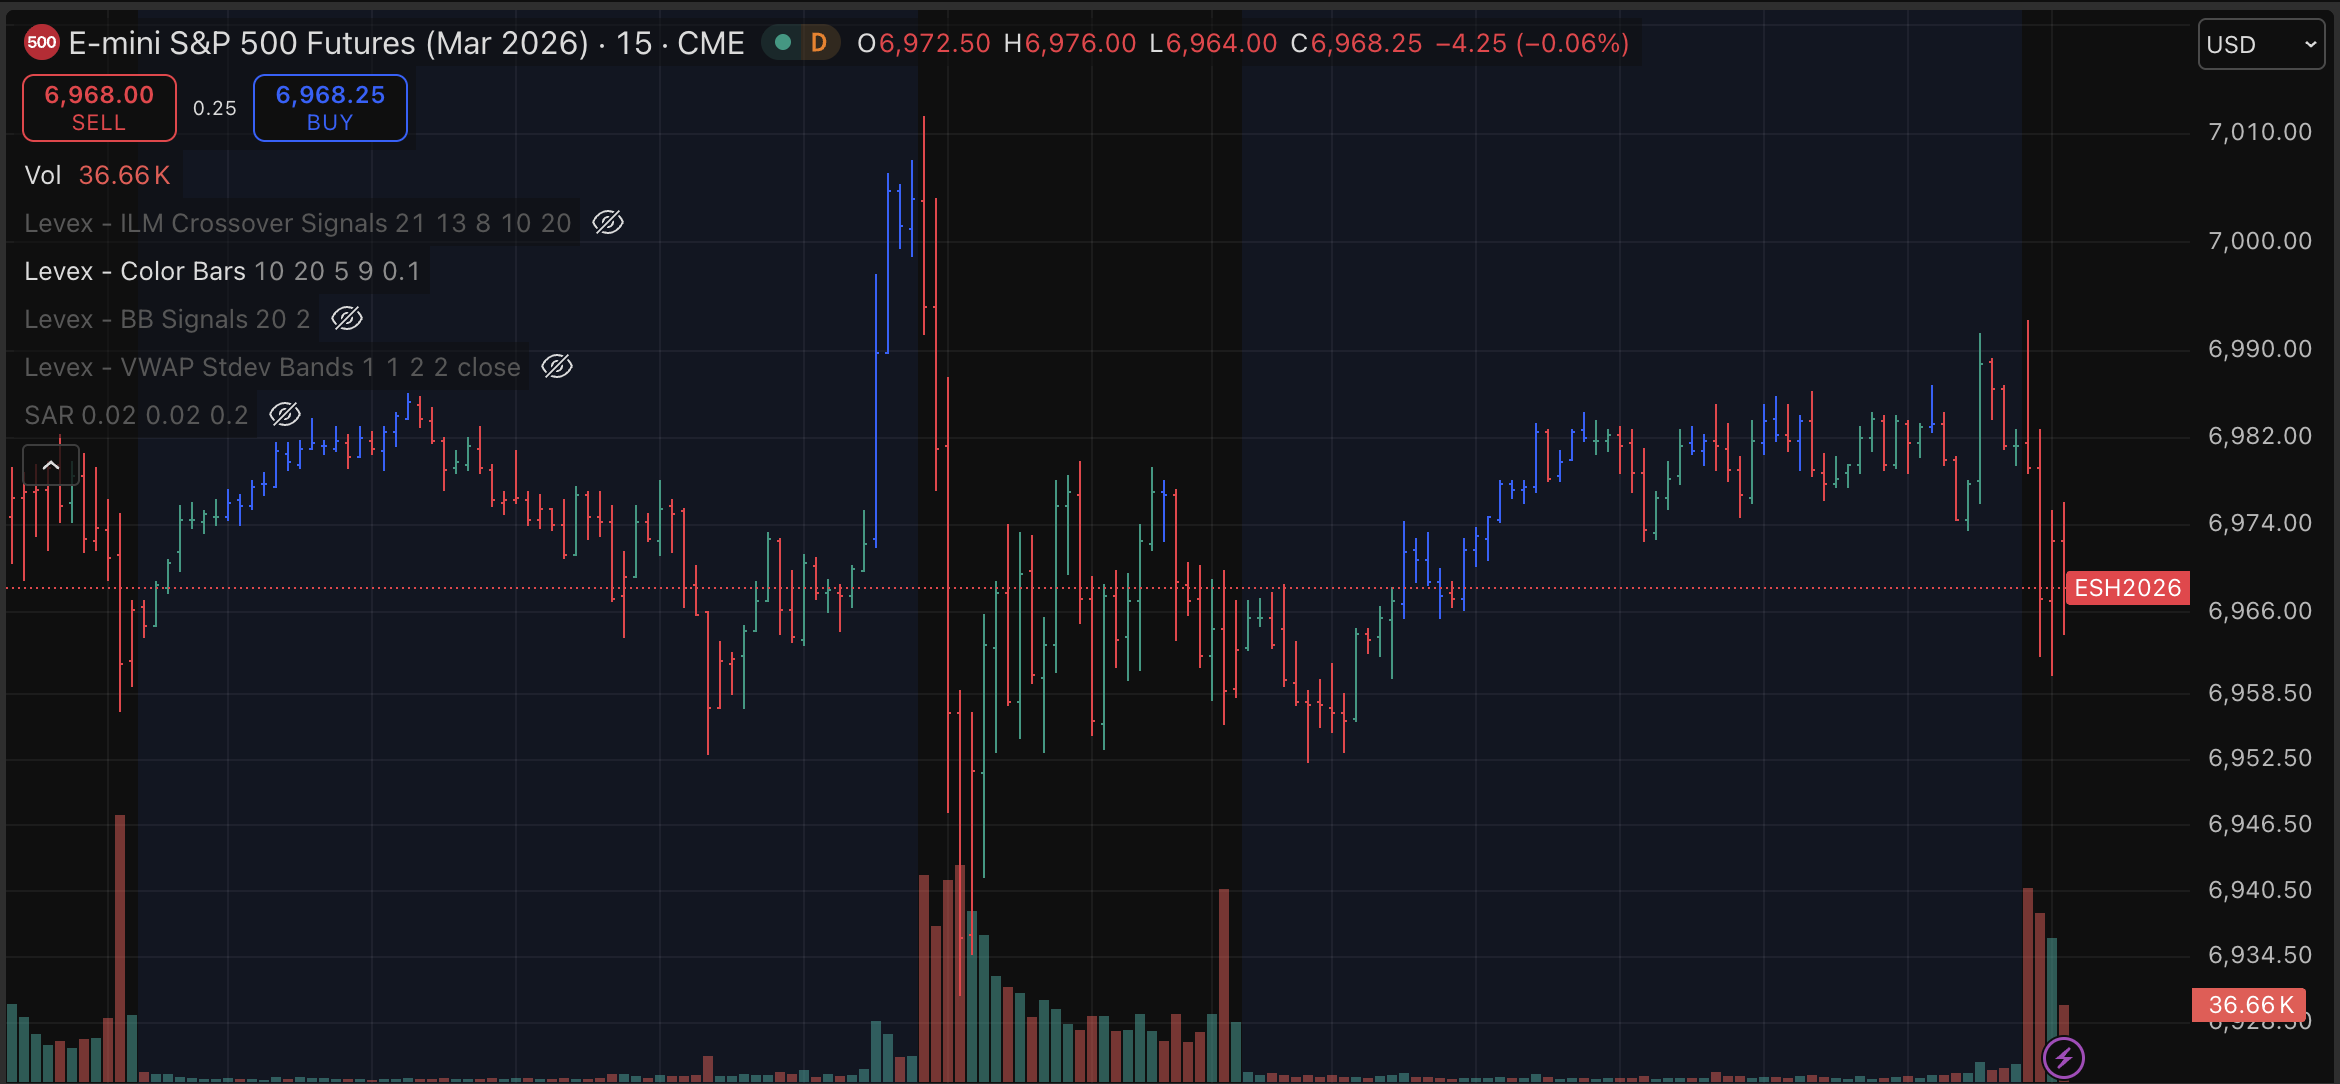
The E-Futures Market Momentum Bars study transforms complex market data into an intuitive visual framework that helps traders quickly assess prevailing market conditions. By analyzing momentum, trend persistence, and price behavior across multiple periods, the study highlights shifts in directional strength directly on the chart.
Instead of requiring traders to interpret multiple indicators simultaneously, Market Momentum Bars provide an immediate visual representation of whether buyers, sellers, or balanced market conditions are currently influencing price action.
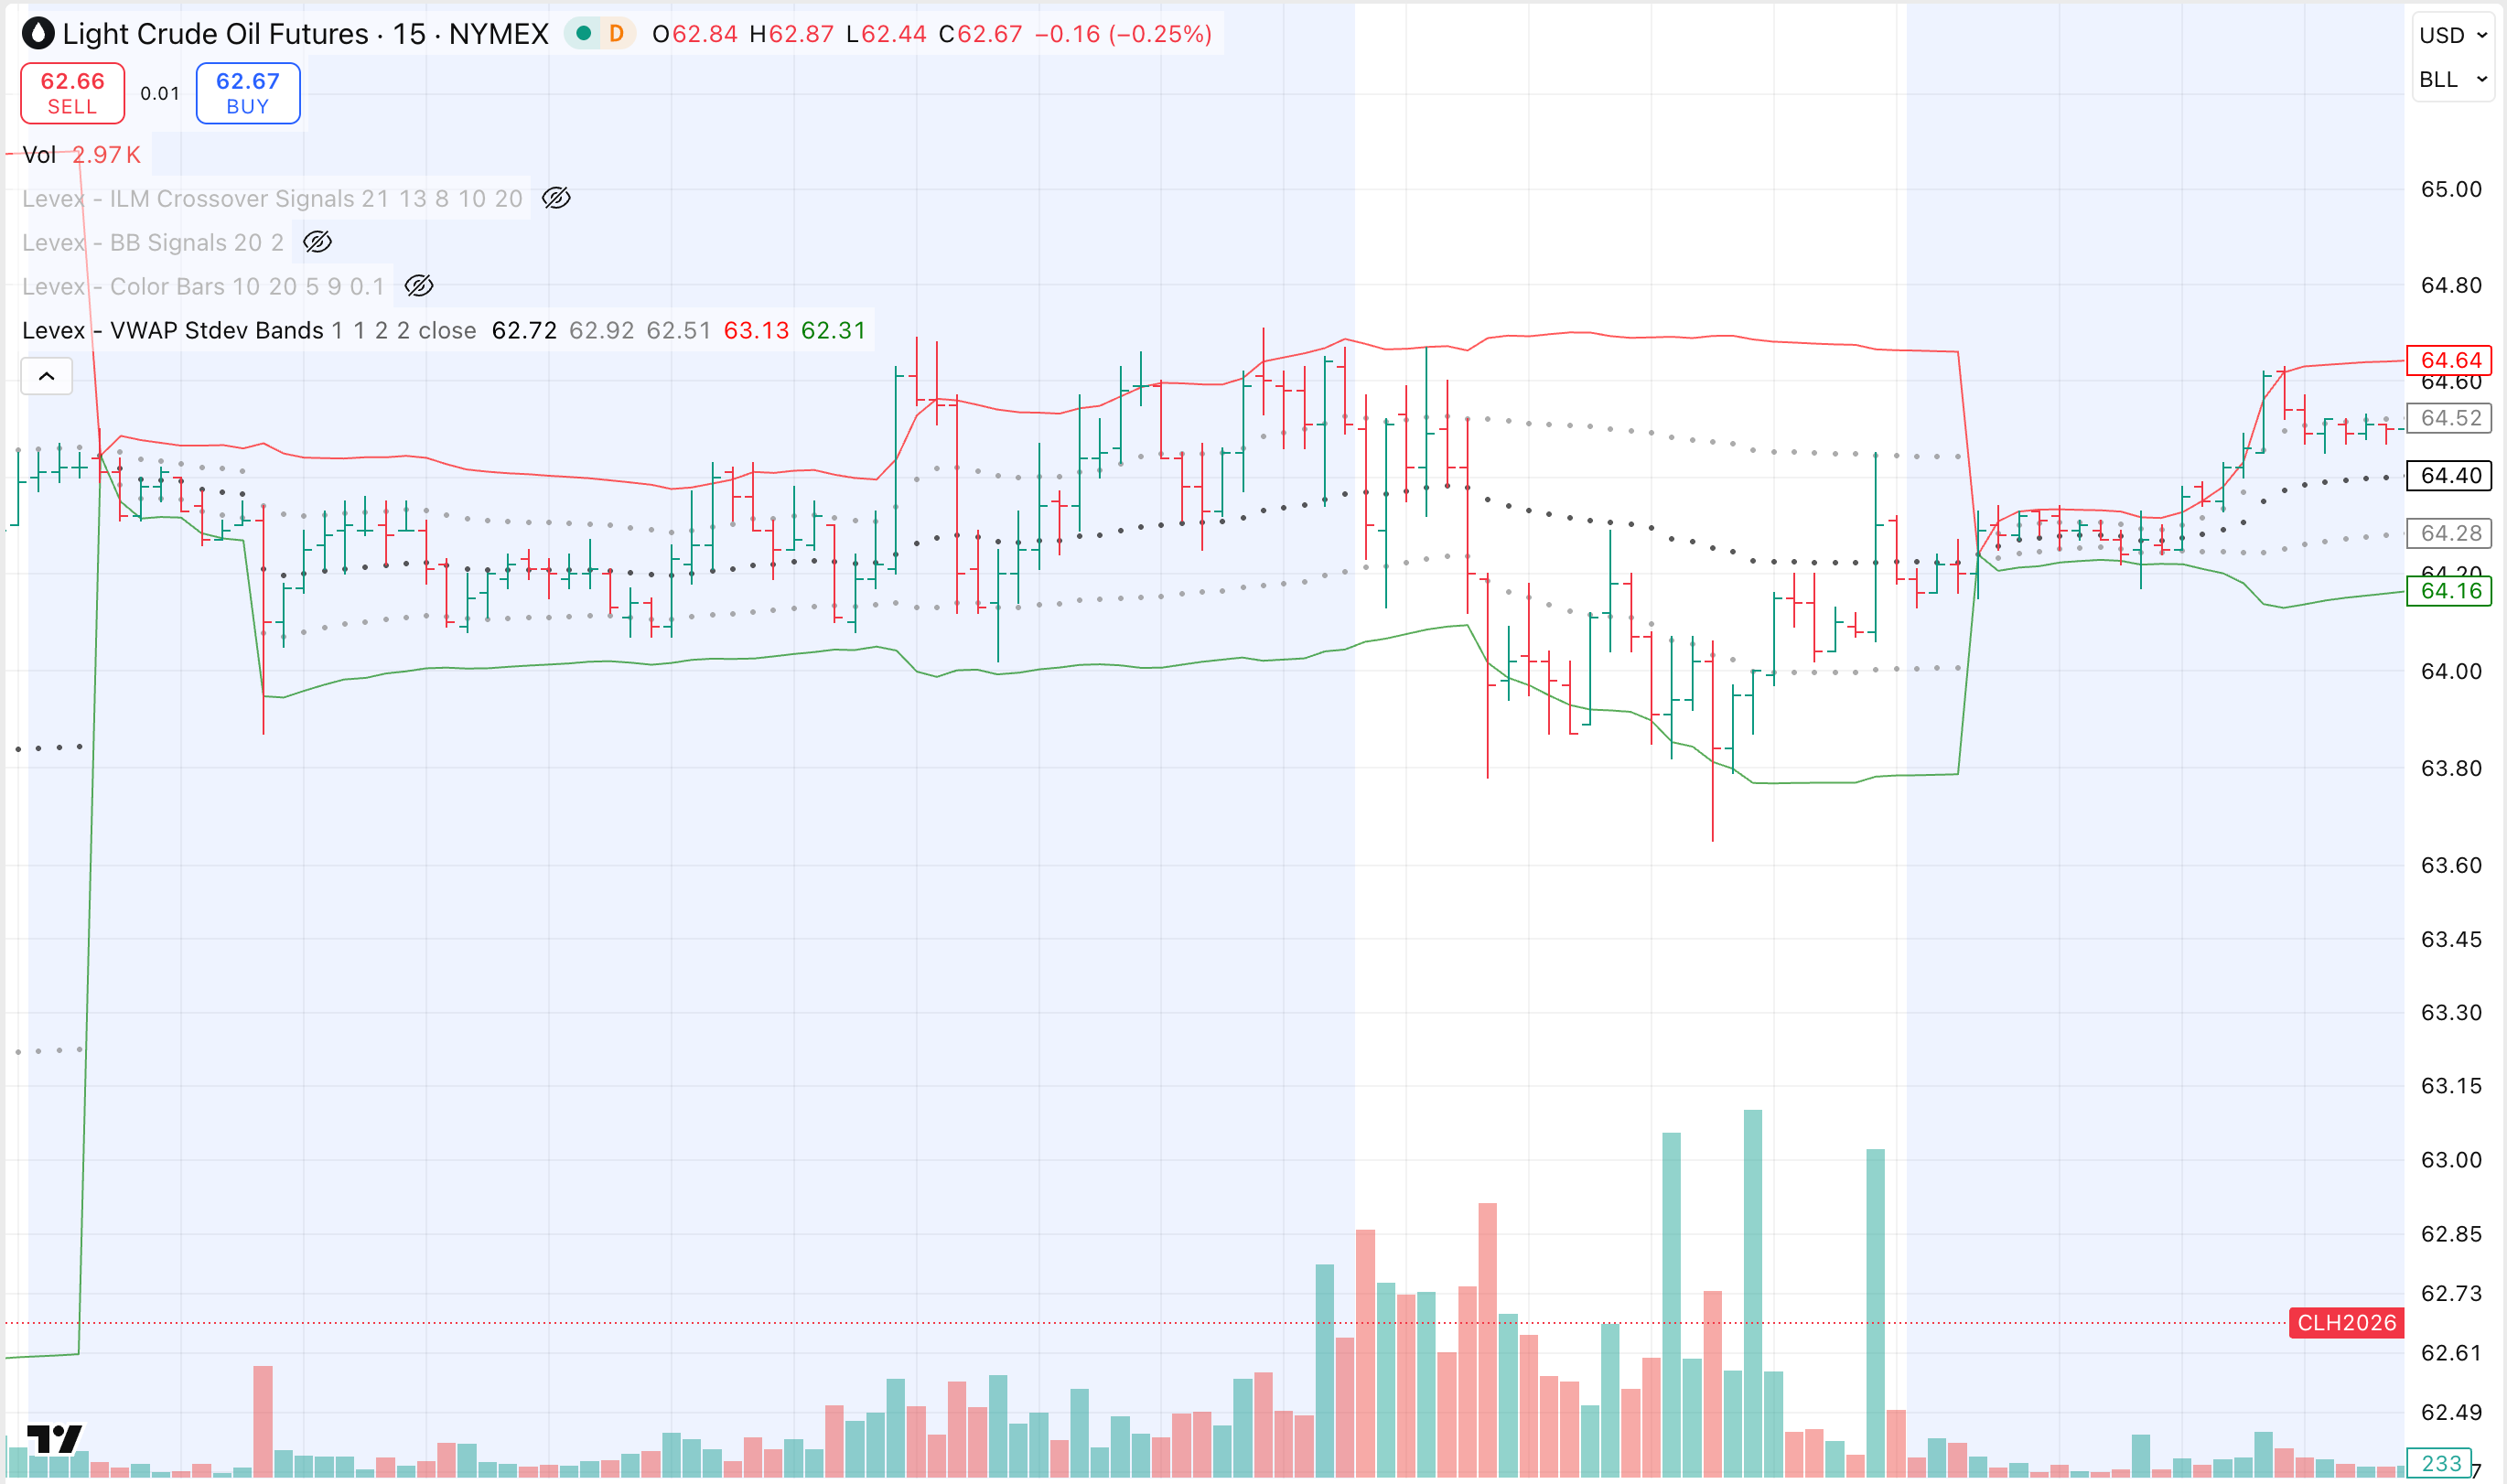
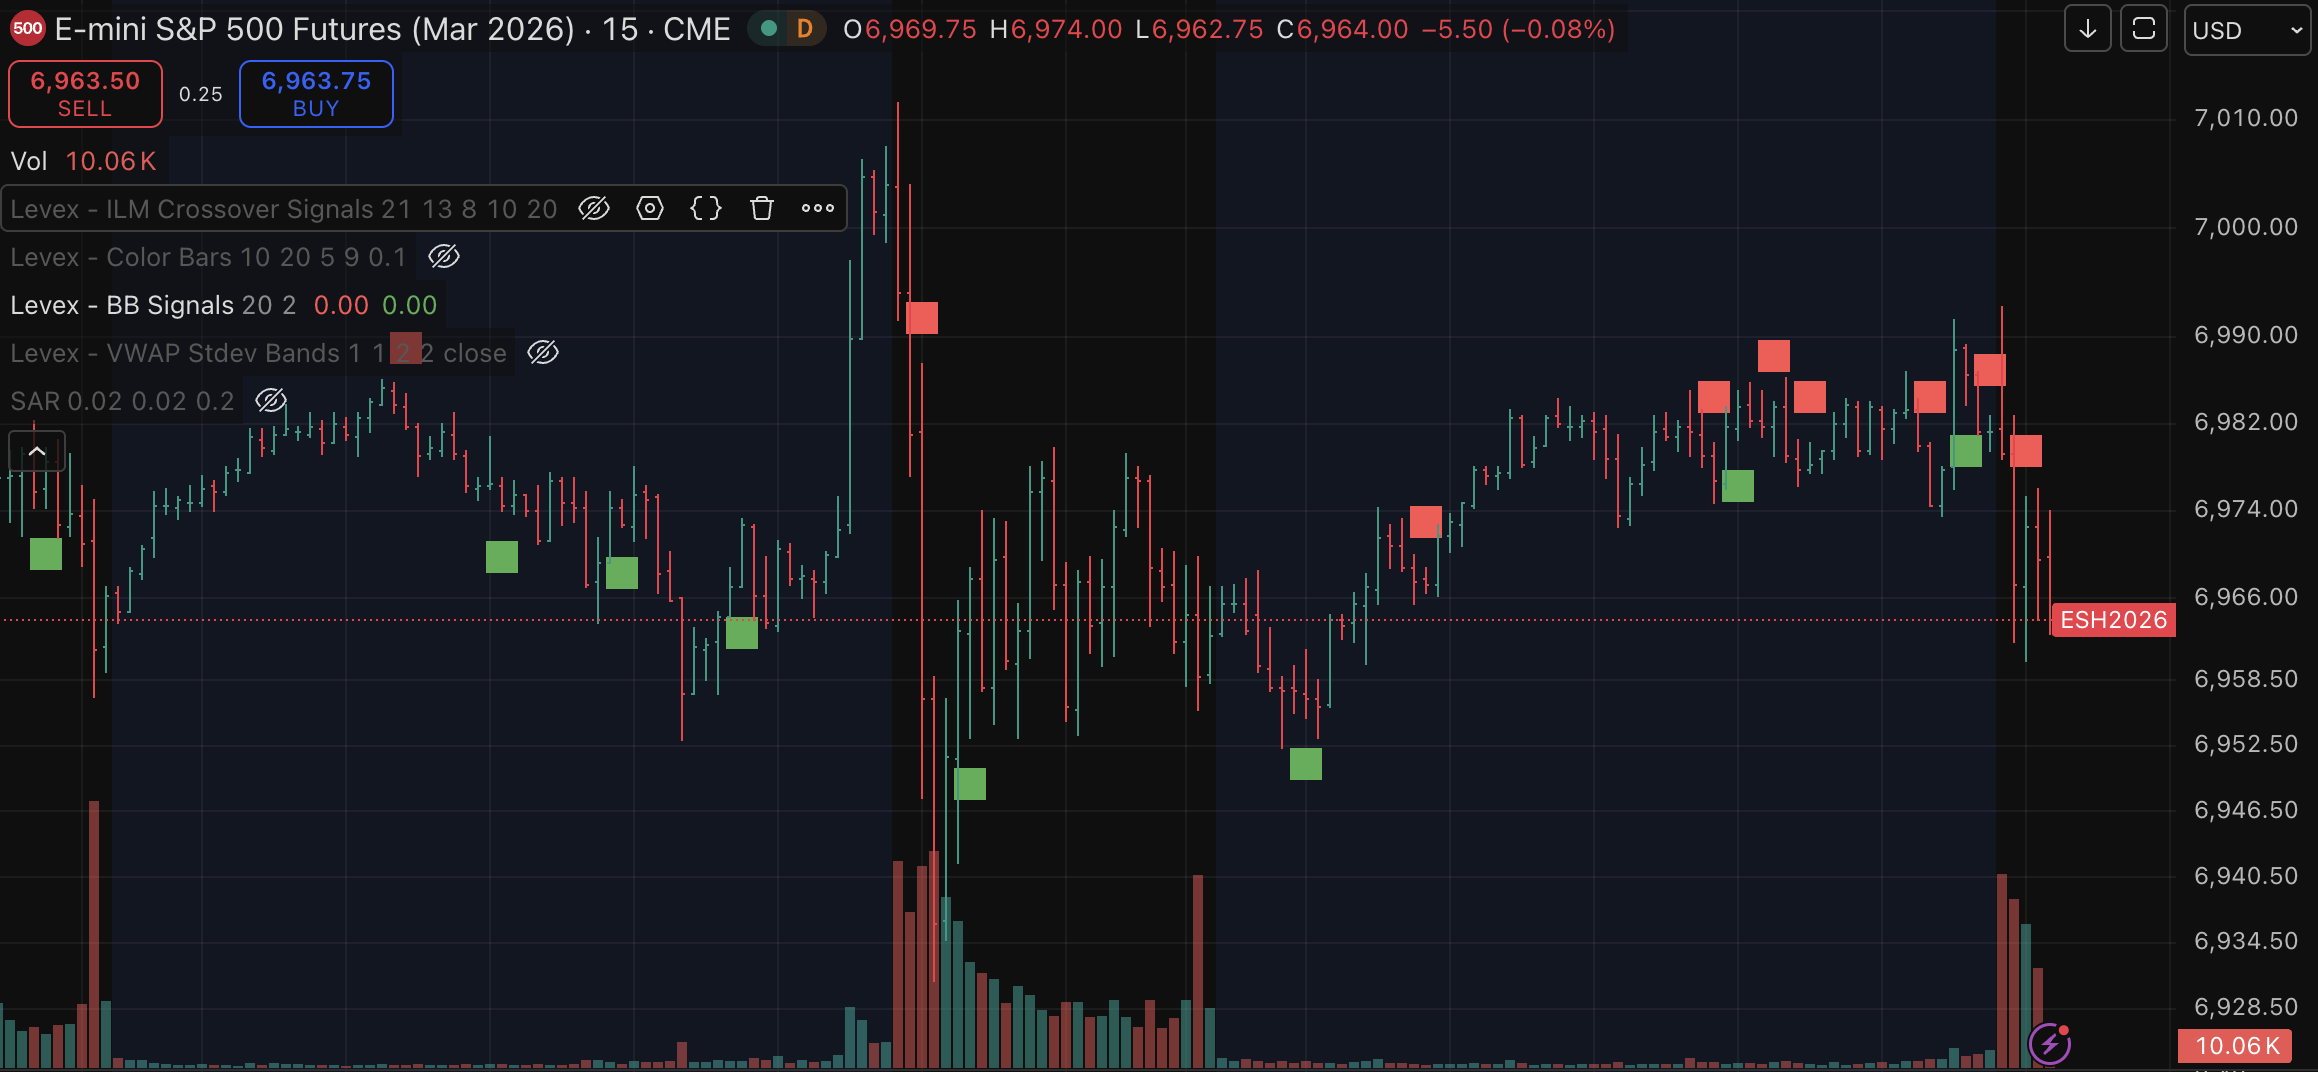
The E-Futures Price Extension Signals study is designed to help traders identify periods when price may be reaching statistically extended levels relative to recent market activity. Built upon volatility-based analysis, the study highlights conditions where momentum may be slowing, profit-taking may emerge, or market participation may begin to shift.
Rather than focusing solely on trade entries, this study is commonly used as a trade management tool to help traders evaluate potential areas for position reduction, profit-taking, or increased caution as markets approach historically significant price extremes.
These trading signals are not a guarantee of profits, a prediction of future market movement, or a substitute for sound risk management. Our objective is to provide traders with tools that may help improve decision-making and market analysis.
Receive timely notifications for potential entries, exits, and trend direction directly within your charting platform.
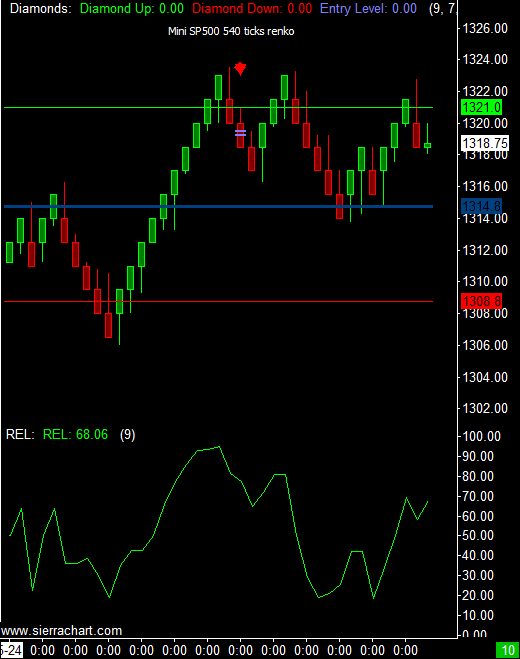
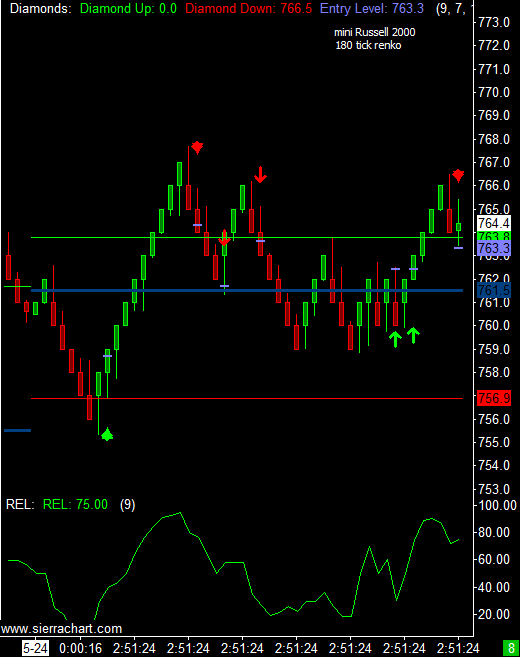
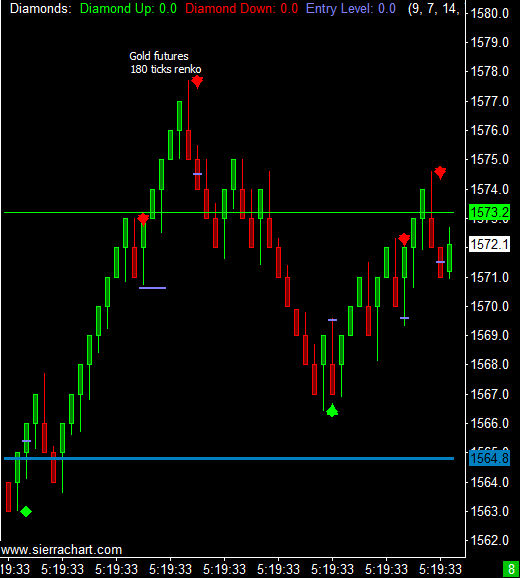
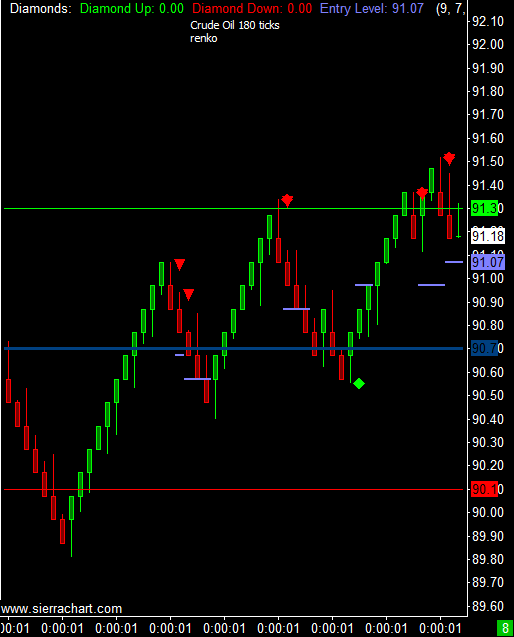
Apply the Diamond ALGO across futures, forex, commodities, indices, and other actively traded markets using virtually any timeframe.
Receive professional onboarding assistance and ongoing support to help you get the most from the indicators and trading tools.
Click any image to enlarge. Examples shown across multiple markets and timeframes.
Fill out the form below to receive your ALGO PAC with installation instructions and your one-on-one onboarding invitation.
Past performance is not necessarily indicative of future results.
Trading futures, options, forex, and other leveraged products involves substantial risk and is not suitable for every investor. You should carefully consider your financial condition, investment objectives, and risk tolerance before participating in any trading activity.
Day trading involves significant risk and can result in substantial financial losses.
Individuals with limited financial resources, limited trading experience, or low risk tolerance should carefully evaluate whether day trading is appropriate for them.
You should be prepared to lose all funds committed to trading and should never trade with money needed for living expenses, debt obligations, education, healthcare, or other essential financial commitments.
Advertising materials and performance examples should not be interpreted as guarantees of future success. While significant profits are possible, substantial losses can occur just as quickly.
Frequent trading may result in considerable commission and transaction costs, which can reduce or eliminate profitability.
Trading on margin may result in losses exceeding your initial deposit.
Maintaining adequate trading capital may improve flexibility and risk management, but no account size can guarantee trading success.
Gain access to professional-grade futures trading tools designed to help you analyze markets with greater consistency and confidence.